Wolfram
Mathematica
8의 신기능: 통계의 시각화
◄
이전
|
다음
►
그래픽 및 시각화
데이터 비교를 위한 쌍별 히스토그램 작성
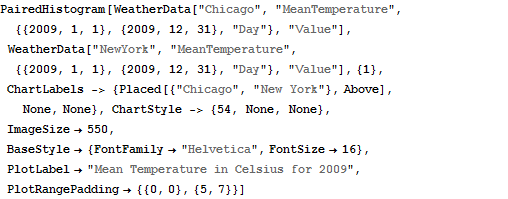
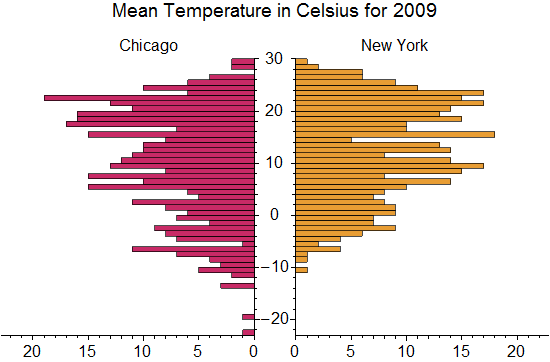
두 개의 데이터 셋을 비교하기 위해 양쪽으로 배치하는 쌍별 히스토그램을 이용합니다.
In[1]:=
X
PairedHistogram[ WeatherData["Chicago", "MeanTemperature", {{2009, 1, 1}, {2009, 12, 31}, "Day"}, "Value"], WeatherData["NewYork", "MeanTemperature", {{2009, 1, 1}, {2009, 12, 31}, "Day"}, "Value"], {1}, ChartLabels -> {Placed[{"Chicago", "New York"}, Above], None, None}, ChartStyle -> {54, None, None}, ImageSize -> 550, BaseStyle -> {FontFamily -> "Helvetica", FontSize -> 16}, PlotLabel -> "Mean Temperature in Celsius for 2009", PlotRangePadding -> {{0, 0}, {5, 7}}]
Out[1]=