Wolfram
Mathematica
8의 신기능: 통계의 시각화
◄
이전
|
다음
►
그래픽 및 시각화
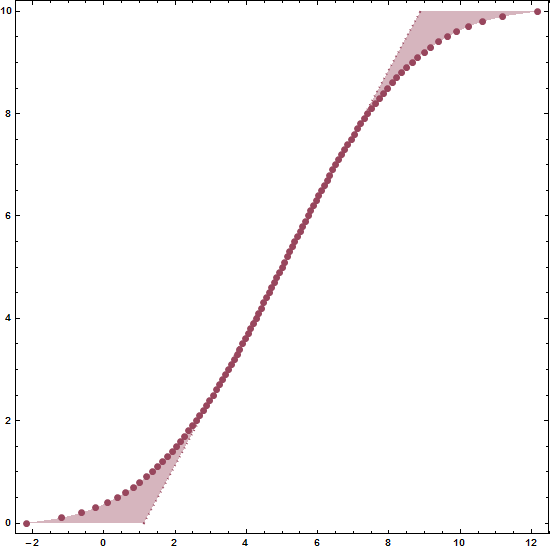
Q-Q 플롯
데이터 셋과 최적화하는 정규 분포와 비교할 수 있는 분위수-분위수 그래프를 만들어 봅니다.
In[1]:=
X
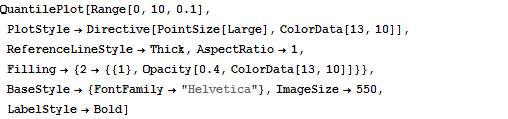
QuantilePlot[Range[0, 10, 0.1], PlotStyle -> Directive[PointSize[Large], ColorData[13, 10]], ReferenceLineStyle -> Thick, AspectRatio -> 1, Filling -> {2 -> {{1}, Opacity[0.4, ColorData[13, 10]]}}, BaseStyle -> {FontFamily -> "Helvetica"}, ImageSize -> 550, LabelStyle -> Bold]
Out[1]=