Gráficos y visualización
Varias funciones diferentes de distribución
Visualice directamente cualquiera de las varias funciones diferentes de distribución, como PDF, CDF, función de supervivencia, función de riesgo y funciones de riesgo acumulativas.
| In[1]:= | 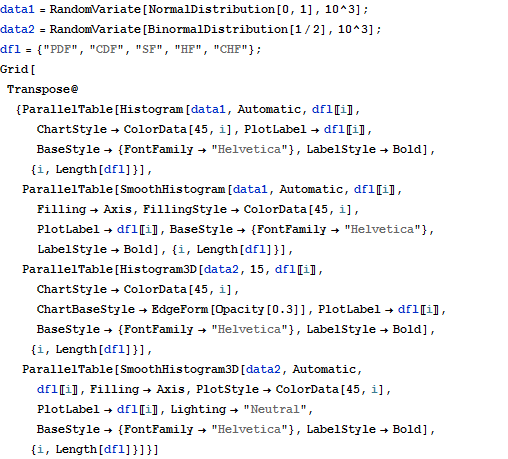 X |
| Out[1]= | 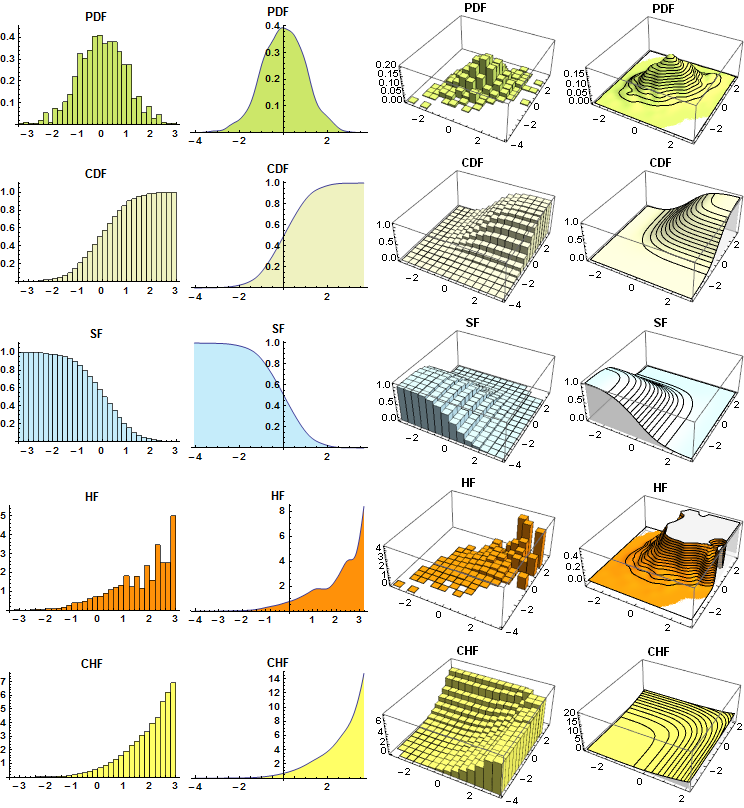 |