Wolfram
Mathematica
8의 신기능: 통계의 시각화
◄
이전
|
다음
►
그래픽 및 시각화
다양한 분포 함수
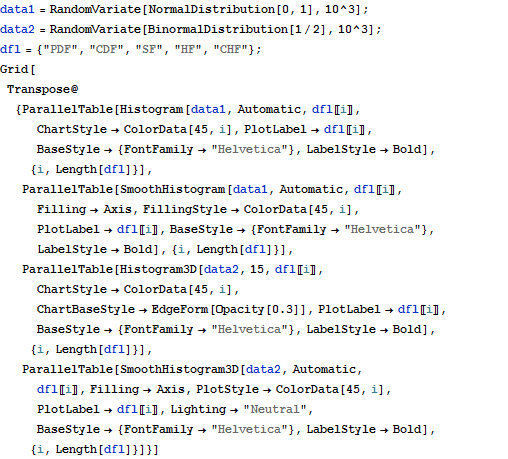
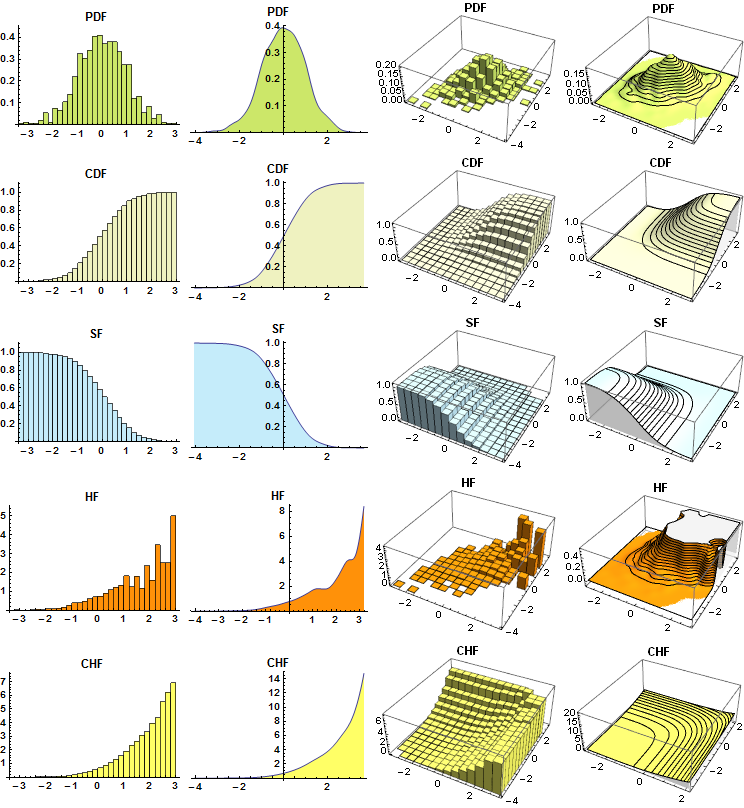
PDF (확률 밀도 함수), CDF (누적 분포 함수), 생존 함수, 위험 함수, 누적 위험 함수와 같은 다양한 분포 함수의 시각화를 알아봅니다.
In[1]:=
X
data1 = RandomVariate[NormalDistribution[0, 1], 10^3]; data2 = RandomVariate[BinormalDistribution[1/2], 10^3]; dfl = {"PDF", "CDF", "SF", "HF", "CHF"}; Grid[Transpose@{ParallelTable[ Histogram[data1, Automatic, dfl[[i]], ChartStyle -> ColorData[45, i], PlotLabel -> dfl[[i]], BaseStyle -> {FontFamily -> "Helvetica"}, LabelStyle -> Bold], {i, Length[dfl]}], ParallelTable[ SmoothHistogram[data1, Automatic, dfl[[i]], Filling -> Axis, FillingStyle -> ColorData[45, i], PlotLabel -> dfl[[i]], BaseStyle -> {FontFamily -> "Helvetica"}, LabelStyle -> Bold], {i, Length[dfl]}], ParallelTable[ Histogram3D[data2, 15, dfl[[i]], ChartStyle -> ColorData[45, i], ChartBaseStyle -> EdgeForm[Opacity[0.3]], PlotLabel -> dfl[[i]], BaseStyle -> {FontFamily -> "Helvetica"}, LabelStyle -> Bold], {i, Length[dfl]}], ParallelTable[ SmoothHistogram3D[data2, Automatic, dfl[[i]], Filling -> Axis, PlotStyle -> ColorData[45, i], PlotLabel -> dfl[[i]], Lighting -> "Neutral", BaseStyle -> {FontFamily -> "Helvetica"}, LabelStyle -> Bold], {i, Length[dfl]}]}]
Out[1]=