Graphics & Visualization
Specify Bandwidth and Kernel for Smooth Histograms
Plot smooth histograms using automatic or specified bandwidths and kernels.
| In[1]:= | 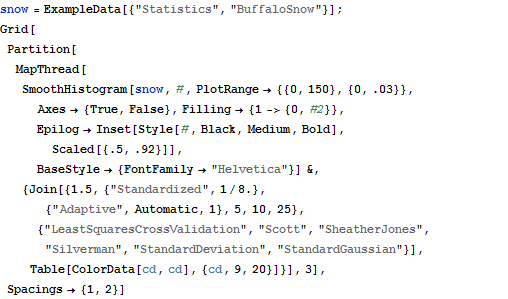 X |
| Out[1]= | 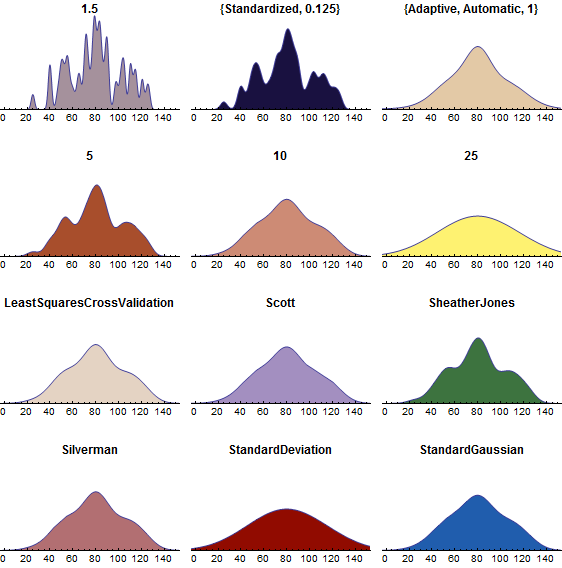 |
| New in Wolfram Mathematica 8: Statistical Visualization | ◄ previous | next ► |
| In[1]:= | X |
| Out[1]= | |