Wolfram
Mathematica
8의 신기능: 통계의 시각화
◄
이전
|
다음
►
그래픽 및 시각화
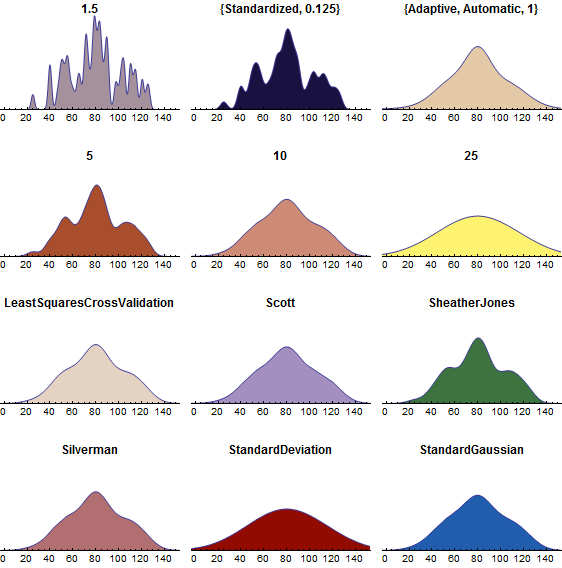
Smooth 히스토그램 대역폭과 커널 지정하기
자동 또는 지정된 대역폭과 커널을 이용하여 smooth 히스토그램 그래프를 그립니다.
In[1]:=
X
snow = ExampleData[{"Statistics", "BuffaloSnow"}]; Grid[ Partition[ MapThread[ SmoothHistogram[snow, #, PlotRange -> {{0, 150}, {0, .03}}, Axes -> {True, False}, Filling -> {1 -> {0, #2}}, Epilog -> Inset[Style[#, Black, Medium, Bold], Scaled[{.5, .92}]], BaseStyle -> {FontFamily -> "Helvetica"}] &, {Join[{1.5, {"Standardized", 1/8.}, {"Adaptive", Automatic, 1}, 5, 10, 25}, {"LeastSquaresCrossValidation", "Scott", "SheatherJones", "Silverman", "StandardDeviation", "StandardGaussian"}], Table[ColorData[cd, cd], {cd, 9, 20}]}], 3], Spacings -> {1, 2}]
Out[1]=