Wolfram
Mathematica
8의 신기능: 통계의 시각화
◄
이전
|
다음
►
그래픽 및 시각화
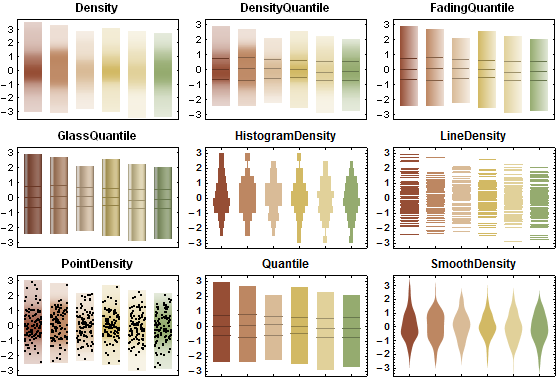
분포도 그래프의 내장 모양 사용하기
분포도 그래프의 여러가지 랜더링 함수 중에서 선택하여 사용할 수 있습니다.
In[1]:=
X
data = RandomVariate[ NormalDistribution[RandomInteger[5], 1], {6, 100}];
In[2]:=
X
Grid[Partition[ BoxWhiskerChart[data, ChartElementFunction -> #, PlotLabel -> #, ChartStyle -> 33, BaseStyle -> {FontFamily -> "Helvetica"}, LabelStyle -> Bold] & /@ ChartElementData["DistributionChart"], 3]]
Out[2]=