Gráficos y visualización
Visualice distribuciones marginales para distribuciones estimadas
Combine un histograma suave de la duración de las erupciones de Old Faithful e intervalos con histogramas suaves para los componentes específicos.
| In[1]:= | X |
| In[2]:= | 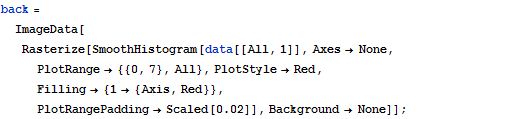 X |
| In[3]:= | 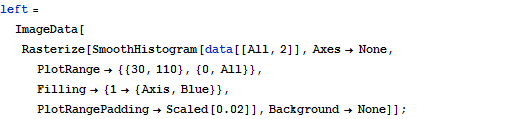 X |
| In[4]:= | 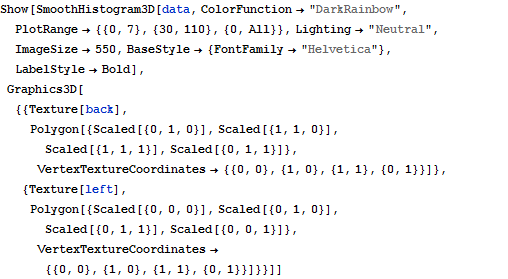 X |
| Out[4]= | 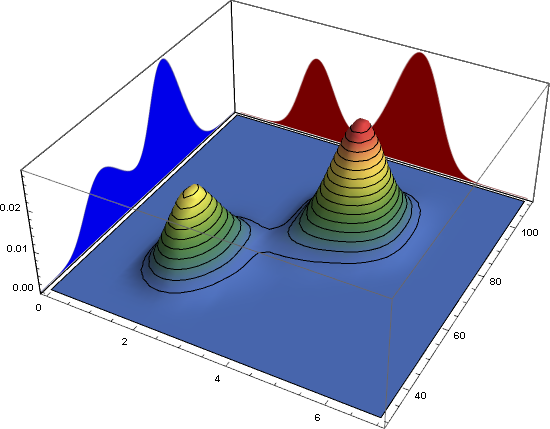 |