Wolfram
Mathematica
8의 신기능: 웨이블릿 분석
◄
이전
|
다음
►
응용 분야
다차원 배열의 직접 변환
n 차원 데이터의 웨이블릿 변환을 수행 합니다.
In[1]:=
X
data = CrossMatrix[All, {8, 8, 8}];
In[2]:=
X
dwd = LiftingWaveletTransform[data, Automatic, 1];
In[3]:=
X
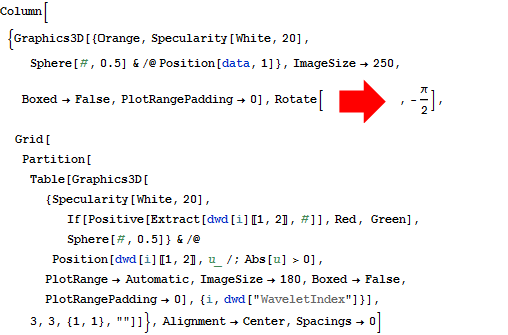
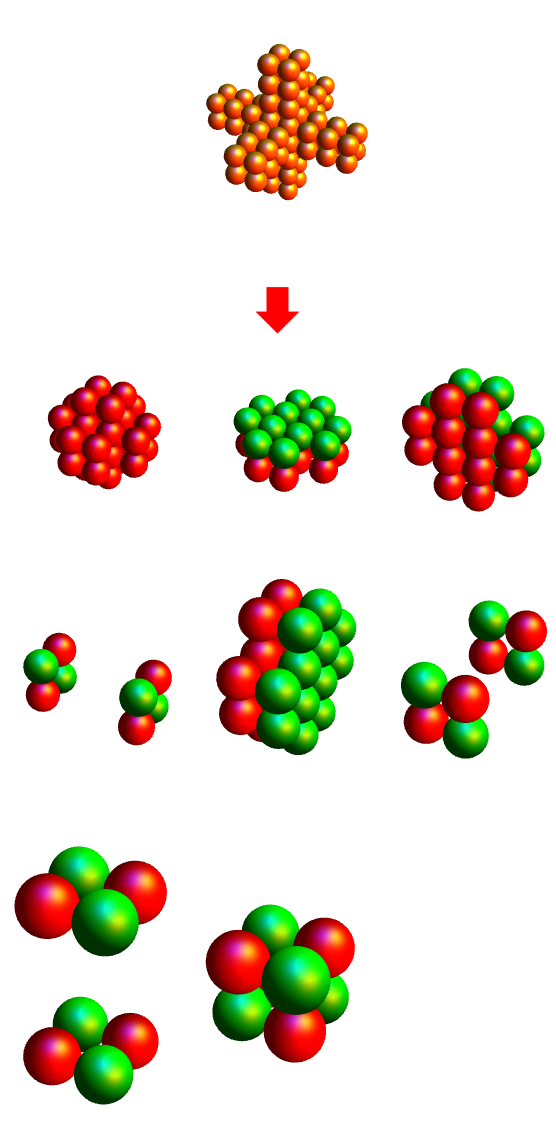
Column[{Graphics3D[{Orange, Specularity[White, 20], Sphere[#, 0.5] & /@ Position[data, 1]}, ImageSize -> 250, Boxed -> False, PlotRangePadding -> 0], Rotate[\!\(\* GraphicsBox[ {Thickness[0.05263157894736842], FaceForm[{RGBColor[1, 0, 0], Opacity[ 1.]}], FilledCurveBox[{{{0, 2, 0}, {0, 1, 0}, {0, 1, 0}, {0, 1, 0}, {0, 1, 0}, {0, 1, 0}}}, {{{9.9999, 18.}, {9.9999, 13.5}, {-0.00009999999999976694, 13.5}, {-0.00009999999999976694, 4.5}, {9.9999, 4.5}, {9.9999, 0.}, {18.9999, 9.}}}]}, AspectRatio->Automatic, ImageSize->{75., 44.}, PlotRange->{{0., 19.}, {0., 18.}}]\), -(\[Pi]/2)], Grid[Partition[ Table[Graphics3D[{Specularity[White, 20], If[Positive[Extract[dwd[i][[1, 2]], #]], Red, Green], Sphere[#, 0.5]} & /@ Position[dwd[i][[1, 2]], u_ /; Abs[u] > 0], PlotRange -> Automatic, ImageSize -> 180, Boxed -> False, PlotRangePadding -> 0], {i, dwd["WaveletIndex"]}], 3, 3, {1, 1}, ""]]}, Alignment -> Center, Spacings -> 0]
Out[3]=