Wolfram
Mathematica
8의 신기능: 웨이블릿 분석
◄
이전
|
다음
►
응용 분야
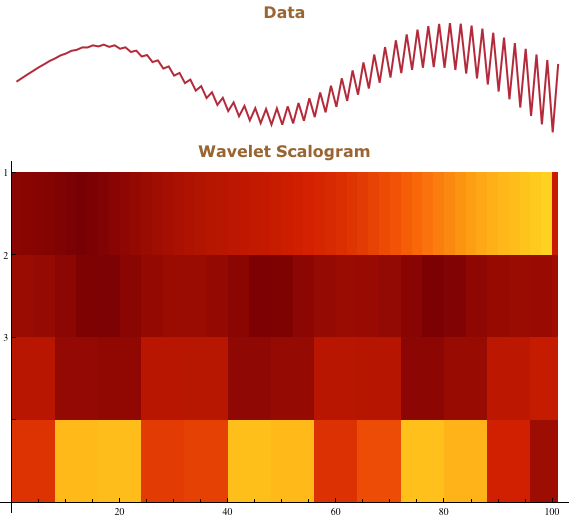
Scalogram을 사용한 이산 웨이블릿 변환의 시각화
이산 웨이블릿 변환을 실행하고 scalogram을 사용하여 결과를 시각화 합니다.
In[1]:=
X
data = Table[n^2 (-1)^(100 n) + Sin[10 n], {n, 0, 1, 0.01}];
In[2]:=
X
dwd = DiscreteWaveletTransform[data, Automatic, 3, Padding -> 0];
In[3]:=
X
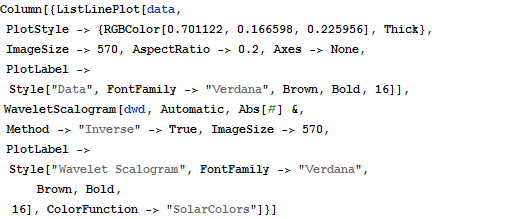
Column[{ListLinePlot[data, PlotStyle -> {RGBColor[0.701122, 0.166598, 0.225956], Thick}, ImageSize -> 570, AspectRatio -> 0.2, Axes -> None, PlotLabel -> Style["Data", FontFamily -> "Verdana", Brown, Bold, 16]], WaveletScalogram[dwd, Automatic, Abs[#] &, Method -> "Inverse" -> True, ImageSize -> 570, PlotLabel -> Style["Wavelet Scalogram", FontFamily -> "Verdana", Brown, Bold, 16], ColorFunction -> "SolarColors"]}]
Out[3]=