응용 분야
공통의 x 축 플롯을 사용한 웨이블릿 변환의 시각화
공통의  축 플롯을 사용하여 웨이블릿 계수를 시각화 합니다.
축 플롯을 사용하여 웨이블릿 계수를 시각화 합니다.| In[1]:= | 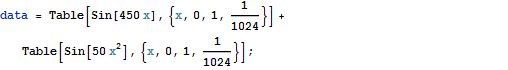 X |
| In[2]:= | X |
| In[3]:= | 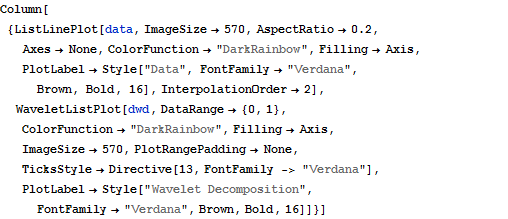 X |
| Out[3]= | 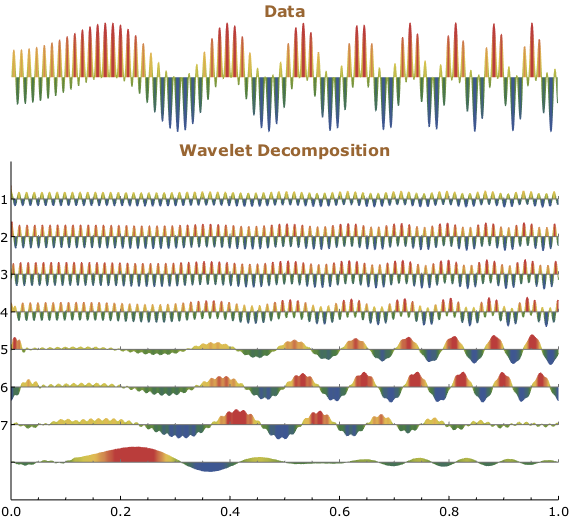 |
| Wolfram Mathematica 8의 신기능: 웨이블릿 분석 | ◄ 이전 | 다음 ► |
축 플롯을 사용하여 웨이블릿 계수를 시각화 합니다.| In[1]:= | X |
| In[2]:= | X |
| In[3]:= | X |
| Out[3]= | |