Wolfram
Mathematica
8의 신기능: 웨이블릿 분석
◄
이전
|
다음
►
응용 분야
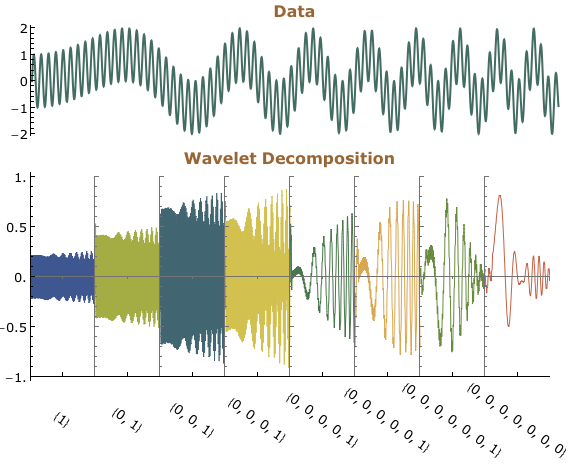
공통의 y 축 플롯을 사용한 웨이블릿 변환의 시각화
웨이블릿 변환을 실행하고 공통의
축 플롯에서 계수를 시각화 합니다.
In[1]:=
X
data = Table[Sin[450 x], {x, 0, 1, 1/1024}] + Table[Sin[50 x^2], {x, 0, 1, 1/1024}];
In[2]:=
X
dwd = StationaryWaveletTransform[data, Automatic, 7];
In[3]:=
X
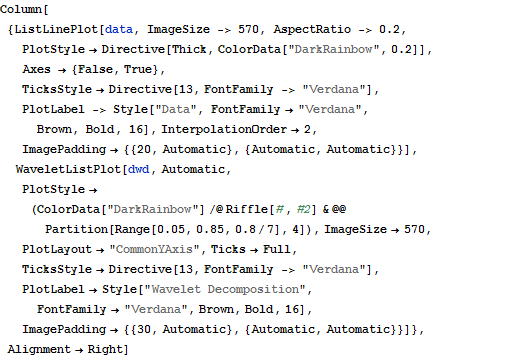
Column[{ListLinePlot[data, ImageSize -> 570, AspectRatio -> 0.2, PlotStyle -> Directive[Thick, ColorData["DarkRainbow", 0.2]], Axes -> {False, True}, TicksStyle -> Directive[13, FontFamily -> "Verdana"], PlotLabel -> Style["Data", FontFamily -> "Verdana", Brown, Bold, 16], InterpolationOrder -> 2, ImagePadding -> {{20, Automatic}, {Automatic, Automatic}}], WaveletListPlot[dwd, Automatic, PlotStyle -> (ColorData["DarkRainbow"] /@ Riffle[#, #2] & @@ Partition[Range[0.05, 0.85, 0.8/7], 4]), ImageSize -> 570, PlotLayout -> "CommonYAxis", Ticks -> Full, TicksStyle -> Directive[13, FontFamily -> "Verdana"], PlotLabel -> Style["Wavelet Decomposition", FontFamily -> "Verdana", Brown, Bold, 16], ImagePadding -> {{30, Automatic}, {Automatic, Automatic}}]}, Alignment -> Right]
Out[3]=
 축 플롯에서 계수를 시각화 합니다. 축 플롯에서 계수를 시각화 합니다.
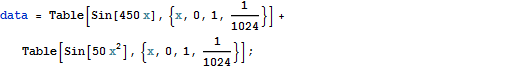
 축 플롯에서 계수를 시각화 합니다.