Новое в системе Wolfram
Mathematica
9
◄
предыдущая
|
следующая
►
Новое в системе Wolfram
Mathematica
9
›
Легенды
Размещение в легенде произвольных объектов
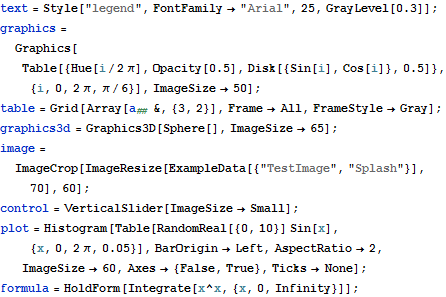
In[1]:=
X
text = Style["legend", FontFamily -> "Arial", 25, GrayLevel[0.3]]; graphics = Graphics[Table[{Hue[i/2 \[Pi]], Opacity[0.5], Disk[{Sin[i], Cos[i]}, 0.5]}, {i, 0, 2 \[Pi], \[Pi]/6}], ImageSize -> 50]; table = Grid[Array[Subscript[a, ##] &, {3, 2}], Frame -> All, FrameStyle -> Gray]; graphics3d = Graphics3D[Sphere[], ImageSize -> 65]; image = ImageCrop[ ImageResize[ExampleData[{"TestImage", "Splash"}], 70], 60]; control = VerticalSlider[ImageSize -> Small]; plot = Histogram[ Table[RandomReal[{0, 10}] Sin[x], {x, 0, 2 \[Pi], 0.05}], BarOrigin -> Left, AspectRatio -> 2, ImageSize -> 60, Axes -> {False, True}, Ticks -> None]; formula = HoldForm[Integrate[x^x, {x, 0, Infinity}]];
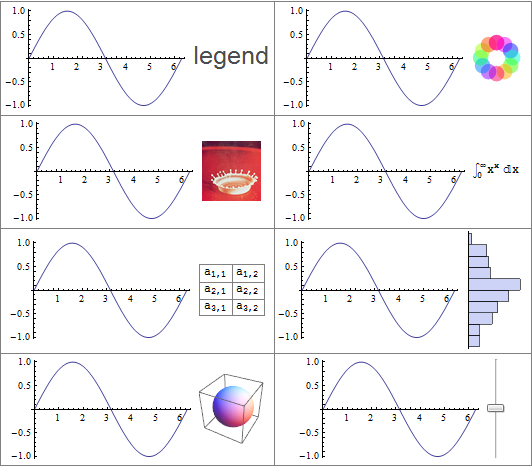
Создание легенд, содержащих таблицы, текст, изображения или графики.
In[2]:=
X
Grid[{{Plot[Sin[x], {x, 0, 2 \[Pi]}, PlotLegends -> text], Plot[Sin[x], {x, 0, 2 \[Pi]}, PlotLegends -> graphics]}, {Plot[ Sin[x], {x, 0, 2 \[Pi]}, PlotLegends -> image], Plot[Sin[x], {x, 0, 2 \[Pi]}, PlotLegends -> formula]}, {Plot[ Sin[x], {x, 0, 2 \[Pi]}, PlotLegends -> table], Plot[Sin[x], {x, 0, 2 \[Pi]}, PlotLegends -> plot]}, {Plot[ Sin[x], {x, 0, 2 \[Pi]}, PlotLegends -> graphics3d], Plot[Sin[x], {x, 0, 2 \[Pi]}, PlotLegends -> control]}}, Frame -> All, FrameStyle -> Gray]
Out[2]=