| New in Wolfram Mathematica 6: Load-on-Demand Curated Data | ◄ previous | next ► |
Create Elaborate Graphical Representations of Data
This makes a log plot of country GDP against population, using country flags as markers.

In[1]:= |  Graphics[Inset[
CountryData[#, "Flag"], {Log[10, CountryData[#, "Population"]],
Log[10, CountryData[#, "GDP"]]}, Center, 0.2] & /@
DeleteCases[CountryData["UN"], "VaticanCity"], Frame -> True,
PlotRangePadding -> .2] |
Out[1]= | 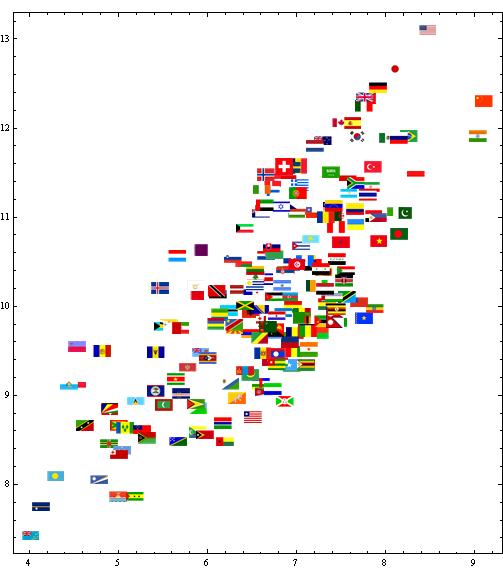 |