| New in Wolfram Mathematica 6: Symbolic Statistical Computing | ◄ previous | next ► |
Visualize Likelihood Functions for Data
The integrated architecture of Mathematica 6 makes it easy to visualize statistical properties of data—here the log likelihood surface for a gamma-distributed sample.

In[1]:= | 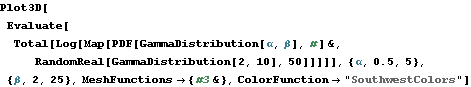 Plot3D[Evaluate[
Total[Log[
Map[PDF[GammaDistribution[\[Alpha], \[Beta]], #] &,
RandomReal[GammaDistribution[2, 10], 50]]]]], {\[Alpha], 0.5,
5}, {\[Beta], 2, 25}, MeshFunctions -> {#3 &},
ColorFunction -> "SouthwestColors"] |
Out[1]= |  |