New in Wolfram Mathematica 7: Automated Charting Graphics  previous | next 
Create Pictorial Bar Charts in 3D
Create a 3D bar chart using a 3D graphic for the bars.
In[1]:=

Click for copyable input
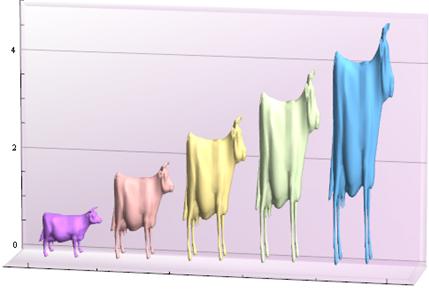
g = ExampleData[{"Geometry3D", "Cow"}];
In[2]:=

Click for copyable input
BarChart3D[Range[5], ChartElements -> g, ChartStyle -> "Pastel"]
Out[2]=