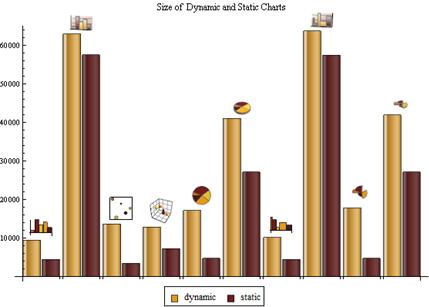
BarChart[data, ChartStyle -> {ColorData[52, 4], ColorData[52, 2]},

 ChartLegends -> Placed[{"dynamic", "static"}, Bottom],

 PlotLabel -> "Size of Dynamic and Static Charts",

 ChartElementFunction -> "GlassRectangle"]