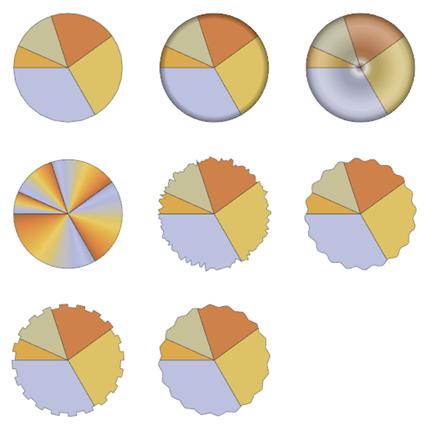
GraphicsGrid@

 Partition[

  Table[PieChart[Range[5], ChartElementFunction -> f,

    ChartStyle -> 46], {f, {"Sector", "PlateauSector", "GlassSector",

     "GradientSector", "NoiseSector", "OscillatingSector",

     "SquareWaveSector", "TriangleWaveSector"}}], 3, 3, 1, ""]