northamerica = ((CountryData[#, {"FullPolygon",
"Mercator"}] & /@ {"USA", "Mexico", "Cuba"}) /.
Polygon :> Line);
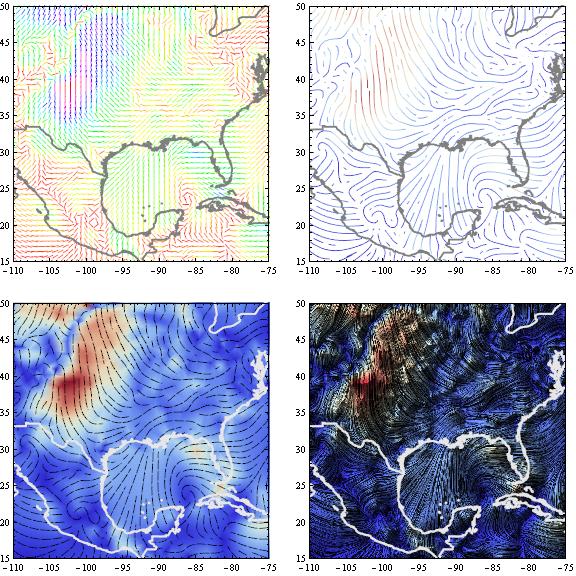
vect = ListVectorPlot[data, VectorPoints -> 50, PlotRange -> All,
AspectRatio -> Automatic, ImageSize -> Large,
DataRange -> {{-110, -75}, {15, 50}}, InterpolationOrder -> 1,
VectorColorFunction -> Hue,
VectorScale -> {Automatic, Small, None}];
gr1 = Show[{vect, Graphics[{Thick, GrayLevel[0.5], northamerica}]},
PlotRange -> {{-110, -75}, {15, 50}}, ImageSize -> Large,
AspectRatio -> Automatic];
strm2 = ListStreamPlot[data, StreamPoints -> {Automatic, 0.5},
StreamScale -> Small, StreamStyle -> "Line", PlotRange -> All,
AspectRatio -> Automatic, ImageSize -> Large,
DataRange -> {{-110, -75}, {15, 50}}, InterpolationOrder -> 1,
StreamColorFunction -> "ThermometerColors", StreamStyle -> {Black}];
gr2 = Show[{strm2, Graphics[{Thick, GrayLevel[0.5], northamerica}]},
PlotRange -> {{-110, -75}, {15, 50}}, AspectRatio -> Automatic,
ImageSize -> Large];
strm = ListStreamDensityPlot[data, StreamPoints -> {Automatic, 1},
StreamScale -> Small, PlotRange -> All, AspectRatio -> Automatic,
ImageSize -> Large, DataRange -> {{-110, -75}, {15, 50}},
InterpolationOrder -> 1, ColorFunction -> "ThermometerColors",
StreamStyle -> {Black}];
gr3 = Show[{strm, Graphics[{Thick, GrayLevel[0.9], northamerica}]},
PlotRange -> {{-110, -75}, {15, 50}}, AspectRatio -> Automatic,
ImageSize -> Large];
lic = ListLineIntegralConvolutionPlot[{data, {Automatic, 700, 128}},
LineIntegralConvolutionScale -> 2, PlotRange -> All,
AspectRatio -> Automatic, ImageSize -> Large,
DataRange -> {{-110, -75}, {15, 50}}, InterpolationOrder -> 1,
ColorFunction -> {"ThermometerColors"}, LightingAngle -> Automatic];
gr4 = Show[{lic, Graphics[{Thick, GrayLevel[0.9], northamerica}]},
PlotRange -> {{-110, -75}, {15, 50}}, ImageSize -> Large,
AspectRatio -> Automatic];
GraphicsGrid[{{gr1, gr2}, {gr3, gr4}}, ImageSize -> Large]