그래픽 및 시각화
특정 분포도에 따른 격자무늬 좌표에서의 데이터 그래프
각각의 분포를 선형화할 수 있도록 스케일하여 축에 데이터를 표시하여 정규 확률 플롯, Weibull 플롯, 로그 정규 확률 플롯, 지수 확률 플롯, Frechet 플롯, Gumbel 플롯, 그리고 Rayleigh 플롯을 만들어 봅니다.
| In[1]:= | X |
| In[2]:= | 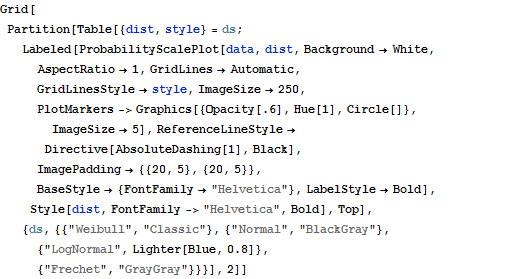 X |
| Out[2]= | 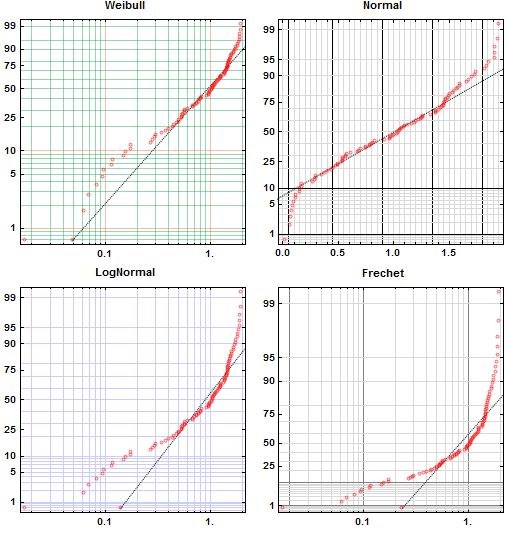 |
| Wolfram Mathematica 8의 신기능: 통계의 시각화 | ◄ 이전 | 다음 ► |
| In[1]:= | X |
| In[2]:= | X |
| Out[2]= | |