Wolfram
Mathematica
8의 신기능: 통계의 시각화
◄
이전
|
다음
►
그래픽 및 시각화
2D 데이터의 조감도 보기
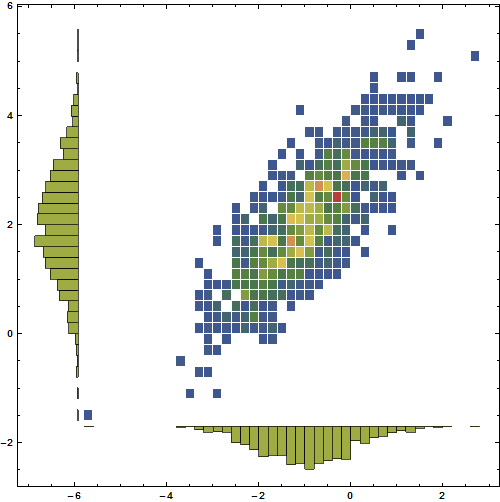
주변 분포를 히스토그램으로 양쪽에 렌더링하여 2D 데이터의 조감도를 살펴봅니다.
In[1]:=
X
data = RandomReal[BinormalDistribution[{-1, 2}, {1, 1}, 0.8], 1000];
In[2]:=
X
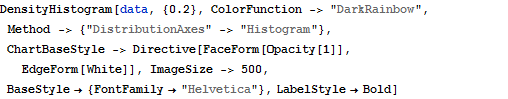
DensityHistogram[data, {0.2}, ColorFunction -> "DarkRainbow", Method -> {"DistributionAxes" -> "Histogram"}, ChartBaseStyle -> Directive[FaceForm[Opacity[1]], EdgeForm[White]], ImageSize -> 500, BaseStyle -> {FontFamily -> "Helvetica"}, LabelStyle -> Bold]
Out[2]=