Gráficos y visualización
Use estilos incorporados para gráficos de cajas y bigotes
Seleccione entre varios estilos con nombre para gráficos de cajas y bigotes.
| In[1]:= | X |
| In[2]:= | 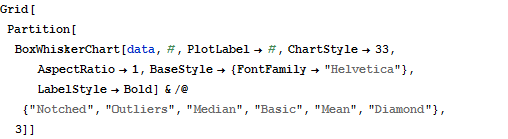 X |
| Out[2]= |  |
| New in Wolfram Mathematica 8: Visualización estadística | ◄ previous | next ► |
| In[1]:= | X |
| In[2]:= | X |
| Out[2]= | |