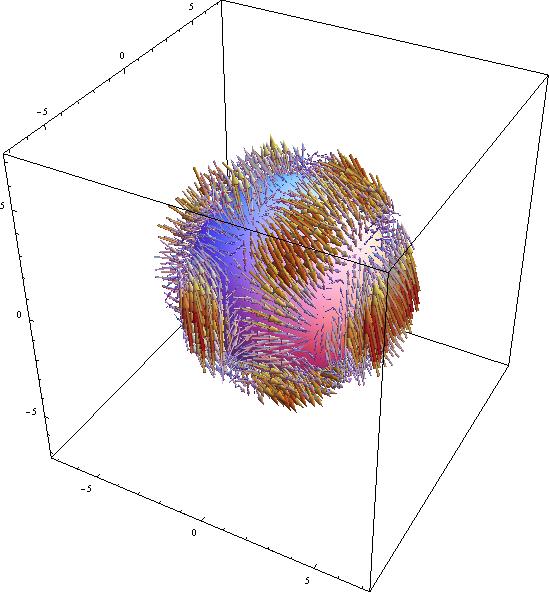
Show[VectorPlot3D[{Sin[x], Sin[y]^2, Cos[z]^3 - Sin[x]}, {x, -6,

   6}, {y, -6, 6}, {z, -6, 6}, VectorStyle -> "Arrow3D",

  VectorPoints -> 25, VectorColorFunction -> "TemperatureMap",

  VectorScale -> {0.1, Scaled[0.5]},

  RegionFunction -> Function[{x, y, z}, 4^2 < x^2 + y^2 + z^2 < 5^2],

  ImageSize -> Large], Graphics3D[Sphere[{0, 0, 0}, 4]]]