New in Wolfram Mathematica 7: Vector & Field Visualization  previous | next 
Plot Streamlines with a Density Background
Draw the density of the norm of the vector field as a background.
In[1]:=

Click for copyable input
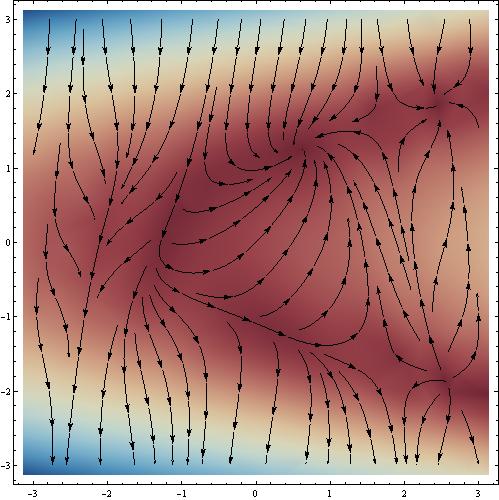
StreamDensityPlot[{Cos[x^2 + y], 1 + x - y^2}, {x, -3, 3}, {y, -3, 3},

  ColorFunction -> "RedBlueTones", StreamStyle -> Black, 

 StreamPoints -> Medium, ImageSize -> Large]
Out[1]=