New in Wolfram Mathematica 7: Statistical Model Analysis  previous | next 
Compute and Visualize Results for an ANCOVA Model
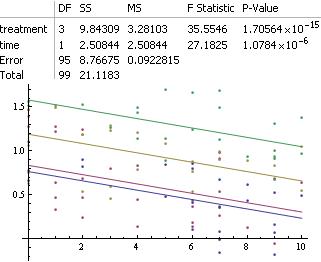
Fit data to an analysis of covariance model, extract the ANOVA table and visualize the level curves for the four treatment groups.
In[1]:=

Click for copyable input
groups = {"control", "treatment 1", "treatment 2", "treatment 3"};

data = BlockRandom[SeedRandom[123];

   Block[{vals, times, rand},

    vals = RandomChoice[groups, 100];

    times = RandomInteger[10, 100];

    rand = RandomReal[1, 100];

    Transpose[{vals, 

      times, (vals /. 

         Thread[Rule[groups, {.16, .34, .57, 1.1}]]) - .05 times + 

       rand}]]];
In[2]:=

Click for copyable input
lm = LinearModelFit[data, {treatment, time}, {treatment, time}, 

   NominalVariables -> treatment];

Grid[{{lm["ANOVATable"]}, {Show[

    ListPlot[Drop[GatherBy[Sort[data], First], None, None, 1], 

     PlotRange -> All], 

    Plot[Evaluate[Map[lm[#, t] &, groups]], {t, 0, 10}]]}}]
Out[2]=