New in Wolfram Mathematica 7: Statistical Model Analysis  previous | next 
Visualize Diagnostics for a Fitted Model
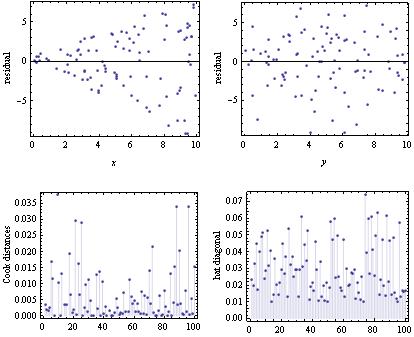
Visually analyze residuals as a function of the predictor variables and inspect pointwise measures of influence for a linear model.
In[1]:=

Click for copyable input
data = Map[{#[[1]], #[[2]], 

     1.2 + (3.7 + RandomReal[{-1, 1}]) #[[1]] - 2 #[[2]]} &, 

   RandomReal[10, {100, 2}]];
In[2]:=

Click for copyable input
lm = LinearModelFit[data, {x, y}, {x, y}];

Grid[{Table[

   ListPlot[Transpose[{data[[All, i]], lm["FitResiduals"]}], 

    Frame -> True, FrameLabel -> {{x, y}[[i]], "residual"}, 

    AspectRatio -> 4/5, ImageSize -> 225], {i, 2}],

  Map[ListPlot[lm[#], Filling -> 0, Frame -> True, 

     AxesOrigin -> {0, 0}, FrameLabel -> {None, lm[#, "Description"]},

      AspectRatio -> 4/5, ImageSize -> 225] &, {"CookDistances", 

    "HatDiagonal"}]}, Spacings -> {Automatic, 2}]
Out[2]=