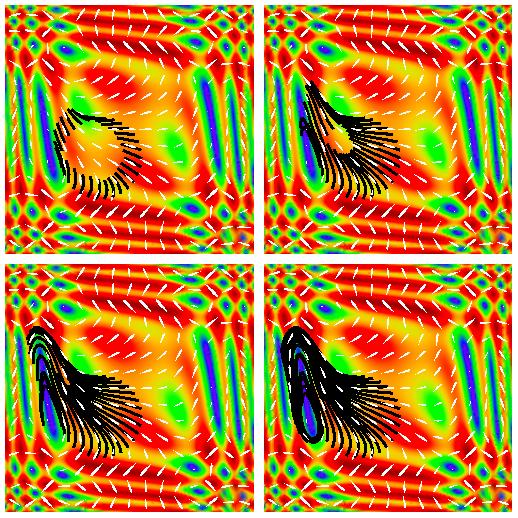
GraphicsGrid[

 Partition[

  VectorDensityPlot[{Cos[x + y^3], Sin[y + x^3]}, {x, -2, 2}, {y, -2,

      2}, StreamPoints -> {{pts -> {Thickness[0.012], Black},

        Automatic}, Fine, {Backward, Scaled[#]}}, StreamScale -> None,

      Epilog -> Point[pts], Frame -> False, MaxRecursion -> 2,

     StreamStyle -> None, ColorFunction -> "VisibleSpectrum",

     ColorFunctionScaling -> {400, 700},

     VectorStyle -> {White, "Drop"}, VectorScale -> Small] & /@ {0.05,

     0.15, 0.25, 0.5}, 2], ImageSize -> Large, Spacings -> 0]