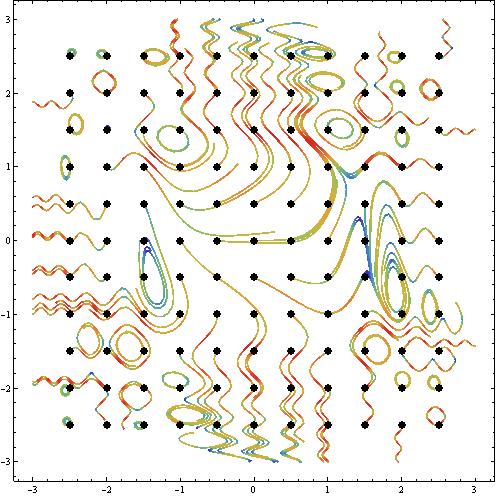
pts = Tuples[Range[-2.5, 2.5, 0.5], 2];
StreamPlot[{Cos[x + y^3], Sin[y + x^3]}, {x, -3, 3}, {y, -3, 3},

 StreamPoints -> {pts -> Thick, Automatic, {Forward, Scaled[0.25]}},

 Epilog -> {PointSize[0.015], Black, Point[pts]}, StreamScale -> None,

  StreamColorFunction -> "Rainbow", ImageSize -> Large]