Wolfram
Mathematica
8의 신기능: 향상된 2D 및 3D 그래픽
◄
이전
|
다음
►
그래픽 및 시각화
다이나믹 화살표의 위치 곡선
다양한 화살표 위치를 나타내는 화살표 곡선을 살펴봅니다.
In[1]:=
X
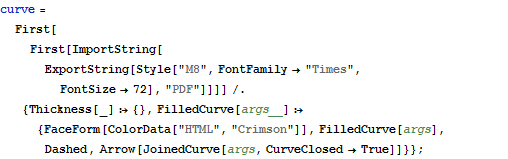
curve = First[ First[ImportString[ ExportString[Style["M8", FontFamily -> "Times", FontSize -> 72], "PDF"]]]] /. {Thickness[_] :> {}, FilledCurve[args__] :> {FaceForm[ColorData["HTML", "Crimson"]], FilledCurve[args], Dashed, Arrow[JoinedCurve[args, CurveClosed -> True]]}};
In[2]:=
X
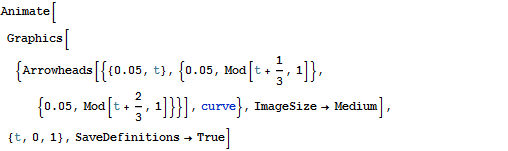
Animate[Graphics[{Arrowheads[{{0.05, t}, {0.05, Mod[t + 1/3, 1]}, {0.05, Mod[t + 2/3, 1]}}], curve}, ImageSize -> Medium], {t, 0, 1}, SaveDefinitions -> True]
Out[2]=
Play Animation
»
Stop Animation
»