Wolfram
Mathematica
8의 신기능: 향상된 2D 및 3D 그래픽
◄
이전
|
다음
►
그래픽 및 시각화
시각화 함수의 텍스처
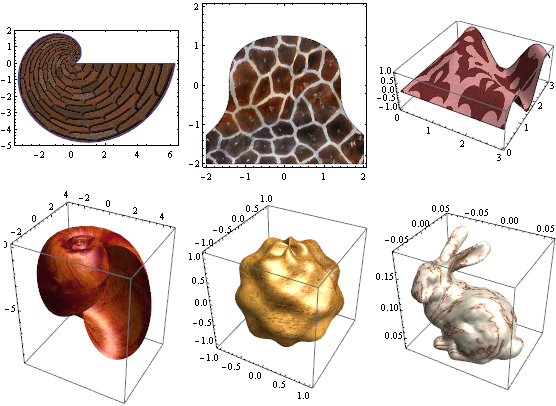
다양한 시각화 함수에 텍스처 적용이 가능합니다.
In[1]:=
X
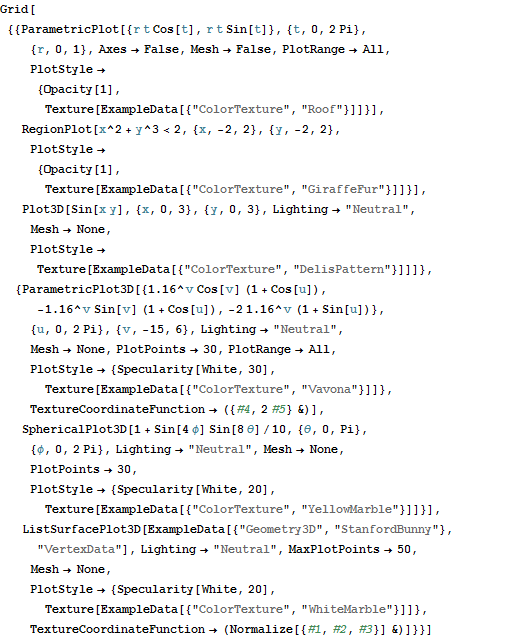
Grid[{{ParametricPlot[{r t Cos[t], r t Sin[t]}, {t, 0, 2 Pi}, {r, 0, 1}, Axes -> False, Mesh -> False, PlotRange -> All, PlotStyle -> {Opacity[1], Texture[ExampleData[{"ColorTexture", "Roof"}]]}], RegionPlot[x^2 + y^3 < 2, {x, -2, 2}, {y, -2, 2}, PlotStyle -> {Opacity[1], Texture[ExampleData[{"ColorTexture", "GiraffeFur"}]]}], Plot3D[Sin[x y], {x, 0, 3}, {y, 0, 3}, Lighting -> "Neutral", Mesh -> None, PlotStyle -> Texture[ExampleData[{"ColorTexture", "DelisPattern"}]]]}, {ParametricPlot3D[{1.16^v Cos[ v] (1 + Cos[u]), -1.16^v Sin[v] (1 + Cos[u]), -2 1.16^ v (1 + Sin[u])}, {u, 0, 2 Pi}, {v, -15, 6}, Lighting -> "Neutral", Mesh -> None, PlotPoints -> 30, PlotRange -> All, PlotStyle -> {Specularity[White, 30], Texture[ExampleData[{"ColorTexture", "Vavona"}]]}, TextureCoordinateFunction -> ({#4, 2 #5} &)], SphericalPlot3D[ 1 + Sin[4 \[Phi]] Sin[8 \[Theta]]/10, {\[Theta], 0, Pi}, {\[Phi], 0, 2 Pi}, Lighting -> "Neutral", Mesh -> None, PlotPoints -> 30, PlotStyle -> {Specularity[White, 20], Texture[ExampleData[{"ColorTexture", "YellowMarble"}]]}], ListSurfacePlot3D[ ExampleData[{"Geometry3D", "StanfordBunny"}, "VertexData"], Lighting -> "Neutral", MaxPlotPoints -> 50, Mesh -> None, PlotStyle -> {Specularity[White, 20], Texture[ExampleData[{"ColorTexture", "WhiteMarble"}]]}, TextureCoordinateFunction -> (Normalize[{#1, #2, #3}] &)]}}]
Out[1]=