Gráficos y visualización
Añada indicadores ilimitados a gráficos de operaciones
Los gráficos de operaciones pueden mostrarse con un número ilimitado de indicadores.
| In[1]:= | X |
| In[2]:= | 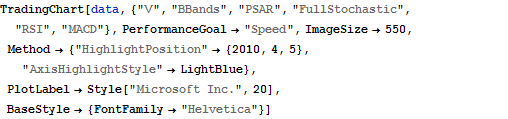 X |
| Out[2]= | 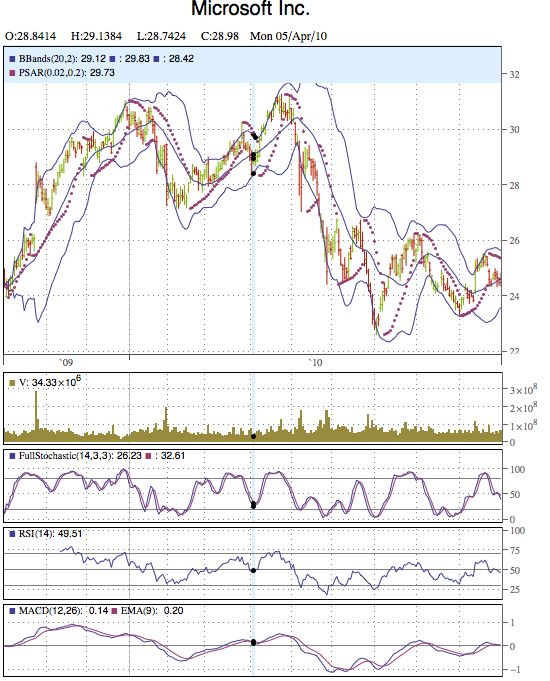 |
| New in Wolfram Mathematica 8: Visualización financiera | ◄ previous | next ► |
| In[1]:= | X |
| In[2]:= | X |
| Out[2]= | |