Графика и визуализация
Создание диаграмм из нефинансовых данных
Анализ произвольных временных рядом с помощью новых финансовых диаграмм.
| In[1]:= | X |
| In[2]:= | 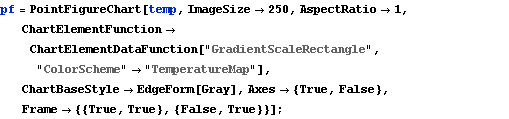 X |
| In[3]:= | 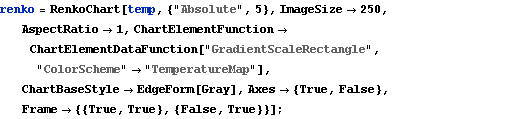 X |
| In[4]:= | 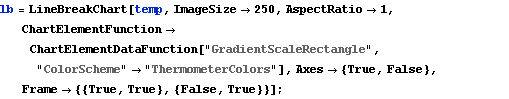 X |
| In[5]:= | X |
| In[6]:= | 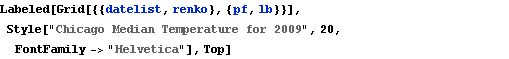 X |
| Out[6]= | 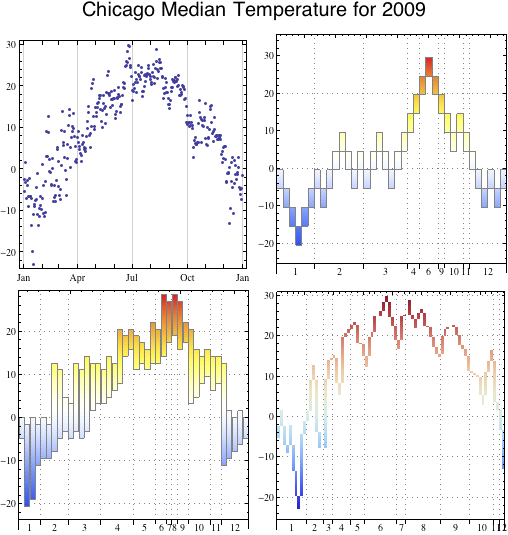 |
| Новое в системе Wolfram Mathematica 8: Финансовая визуализация | ◄ предыдущая | следующая ► |
| In[1]:= | X |
| In[2]:= | X |
| In[3]:= | X |
| In[4]:= | X |
| In[5]:= | X |
| In[6]:= | X |
| Out[6]= | |