Wolfram
Mathematica
8의 신기능: 금융 시각화
◄
이전
|
다음
►
그래픽 및 시각화
세밀한 사용자 정의 도표 작성
모양을 세밀하게 지정하여 사용자 정의한 차트를 작성할 수 있습니다.
In[1]:=
X
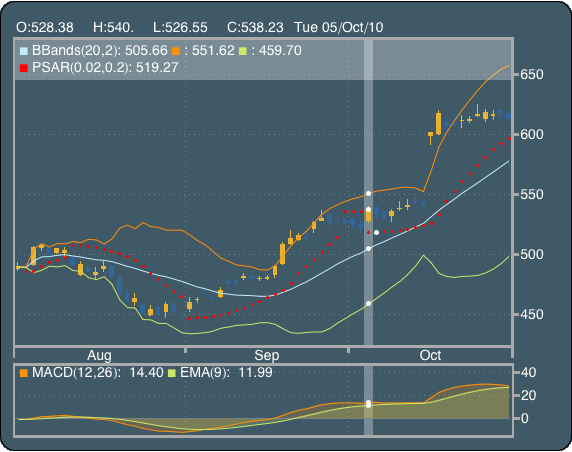
Framed[TradingChart[{"GOOG", {{2010, 8, 1}, {2010, 10, 29}}}, {FinancialIndicator["BBands", "LineStyle" -> Table[ColorData[45][i], {i, {3, 4, 1}}]], FinancialIndicator["PSAR", "LineStyle" -> Red], FinancialIndicator["MACD", "Filling" -> Automatic, "LineStyle" -> Table[ColorData[45][i], {i, {4, 1}}]]}, ImageSize -> 550, PerformanceGoal -> "Speed", TrendStyle -> "BlueYellow", FrameStyle -> Directive[Darker@White, AbsoluteThickness[2]], LabelStyle -> Directive[White, FontFamily -> "Helvetica", FontSize -> 14], AxesStyle -> Directive[White], Method -> {"HighlightPosition" -> {2010, 10, 5}, "HighlightStyle" -> Directive[AbsolutePointSize[5], White], "AxisHighlightStyle" -> Directive[Opacity[0.3], White]}], RoundingRadius -> 15, Background -> RGBColor[0.25, 0.35, 0.4], FrameMargins -> 10]
Out[1]=