Wolfram
Mathematica
8의 신기능: 금융 시각화
◄
이전
|
다음
►
그래픽 및 시각화
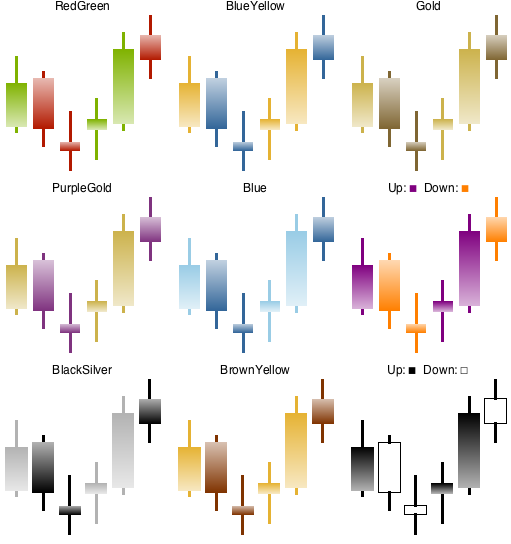
다양한 색상 배합으로 트랜드 강조하기
상승세와 하락세로 명명된 기존 스타일 또는 사용자 지정 스타일을 적용해 사용 합니다.
In[1]:=
X
data = FinancialData["MSFT", "OHLC", {{2010, 1, 8}, {2010, 1, 15}}];
In[2]:=
X
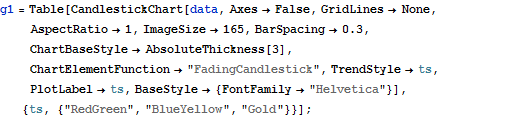
g1 = Table[ CandlestickChart[data, Axes -> False, GridLines -> None, AspectRatio -> 1, ImageSize -> 165, BarSpacing -> 0.3, ChartBaseStyle -> AbsoluteThickness[3], ChartElementFunction -> "FadingCandlestick", TrendStyle -> ts, PlotLabel -> ts, BaseStyle -> {FontFamily -> "Helvetica"}], {ts, {"RedGreen", "BlueYellow", "Gold"}}];
In[3]:=
X
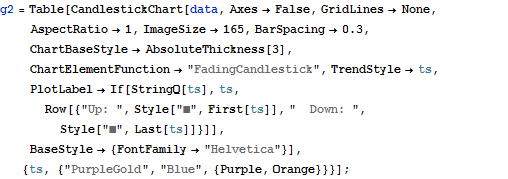
g2 = Table[ CandlestickChart[data, Axes -> False, GridLines -> None, AspectRatio -> 1, ImageSize -> 165, BarSpacing -> 0.3, ChartBaseStyle -> AbsoluteThickness[3], ChartElementFunction -> "FadingCandlestick", TrendStyle -> ts, PlotLabel -> If[StringQ[ts], ts, Row[{"Up: ", Style["\[FilledSquare]", First[ts]], " Down: ", Style["\[FilledSquare]", Last[ts]]}]], BaseStyle -> {FontFamily -> "Helvetica"}], {ts, {"PurpleGold", "Blue", {Purple, Orange}}}];
In[4]:=
X
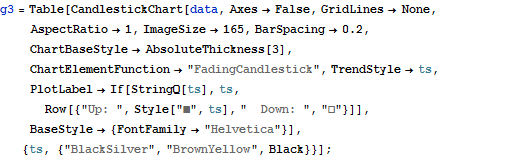
g3 = Table[ CandlestickChart[data, Axes -> False, GridLines -> None, AspectRatio -> 1, ImageSize -> 165, BarSpacing -> 0.2, ChartBaseStyle -> AbsoluteThickness[3], ChartElementFunction -> "FadingCandlestick", TrendStyle -> ts, PlotLabel -> If[StringQ[ts], ts, Row[{"Up: ", Style["\[FilledSquare]", ts], " Down: ", "\[EmptySquare]"}]], BaseStyle -> {FontFamily -> "Helvetica"}], {ts, {"BlackSilver", "BrownYellow", Black}}];
In[5]:=
X
Grid[{g1, g2, g3}]
Out[5]=