New in Wolfram
Mathematica
8: Financial Visualization
◄
previous
|
next
►
Graphics & Visualization
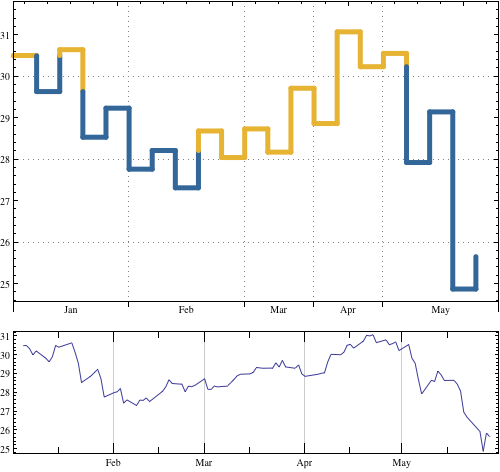
KagiChart
Use a Kagi chart to identify reversals that exceed the previous changing point.
In[1]:=
X
data = FinancialData["MSFT", {{2010, 1}, {2010, 5, 30}}];
In[2]:=
X
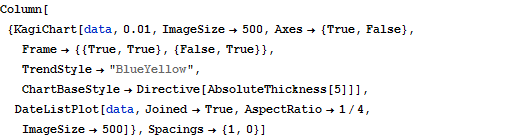
Column[{KagiChart[data, 0.01, ImageSize -> 500, Axes -> {True, False}, Frame -> {{True, True}, {False, True}}, TrendStyle -> "BlueYellow", ChartBaseStyle -> Directive[AbsoluteThickness[5]]], DateListPlot[data, Joined -> True, AspectRatio -> 1/4, ImageSize -> 500]}, Spacings -> {1, 0}]
Out[2]=