Graphics & Visualization
LineBreakChart
Use a three-line break chart to identify reversals of trends that have persisted for the previous three periods.
| In[1]:= | X |
| In[2]:= | 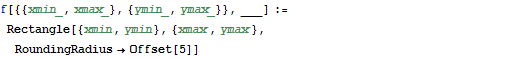 X |
| In[3]:= | 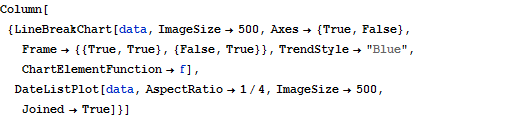 X |
| Out[3]= | 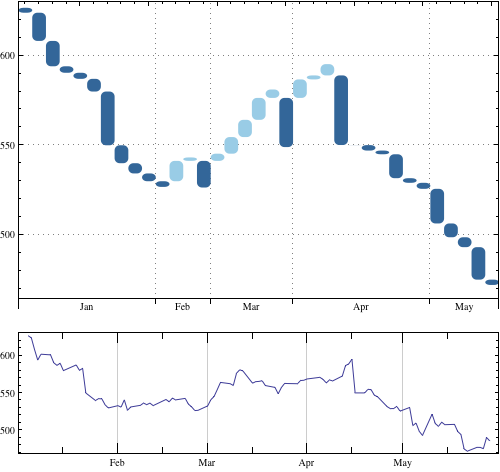 |
| New in Wolfram Mathematica 8: Financial Visualization | ◄ previous | next ► |
| In[1]:= | X |
| In[2]:= | X |
| In[3]:= | X |
| Out[3]= | |