Gráficos y visualización
Use Placed para ubicar etiquetas
Use Placed para especificar cómo deben ubicarse las etiquetas en relación a la fecha y a los precios en un gráfico.
| In[1]:= | 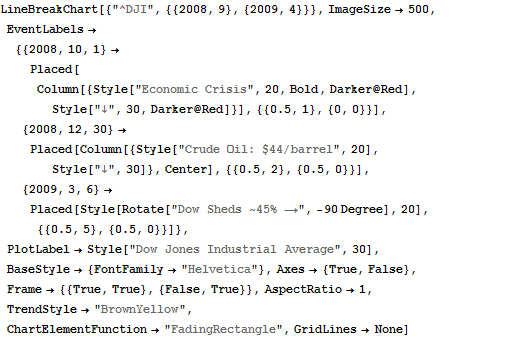 X |
| Out[1]= | 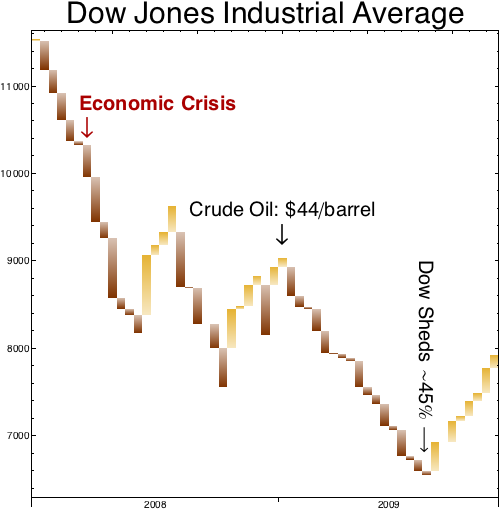 |
| New in Wolfram Mathematica 8: Visualización financiera | ◄ previous | next ► |
| In[1]:= | X |
| Out[1]= | |