Novos Recursos do
Mathematica
8: Visualização Financeira
◄
anterior
|
próximo
►
Gráficos & Visualização
Use a função Placed para marcar pontos específicos
Use a função
Placed
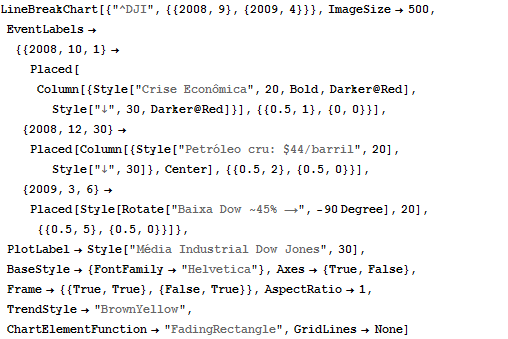
para especificar como etiquetas devem ser posicionadas em relação a datas e preços em um gráfico.
In[1]:=
X
LineBreakChart[{"^DJI", {{2008, 9}, {2009, 4}}}, ImageSize -> 500, EventLabels -> {{2008, 10, 1} -> Placed[Column[{Style["Crise Econômica", 20, Bold, Darker@Red], Style["\[DownArrow]", 30, Darker@Red]}], {{0.5, 1}, {0, 0}}], {2008, 12, 30} -> Placed[Column[{Style["Petróleo cru: $44/barril", 20], Style["\[DownArrow]", 30]}, Center], {{0.5, 2}, {0.5, 0}}], {2009, 3, 6} -> Placed[Style[ Rotate["Baixa Dow ~45% \[LongRightArrow]", -90 Degree], 20], {{0.5, 5}, {0.5, 0}}]}, PlotLabel -> Style["Média Industrial Dow Jones", 30], BaseStyle -> {FontFamily -> "Helvetica"}, Axes -> {True, False}, Frame -> {{True, True}, {False, True}}, AspectRatio -> 1, TrendStyle -> "BrownYellow", ChartElementFunction -> "FadingRectangle", GridLines -> None]
Out[1]=