Novos Recursos do
Mathematica
8: Visualização Financeira
◄
anterior
|
próximo
►
Gráficos & Visualização
Use visualização estatística para analisar dados financeiros
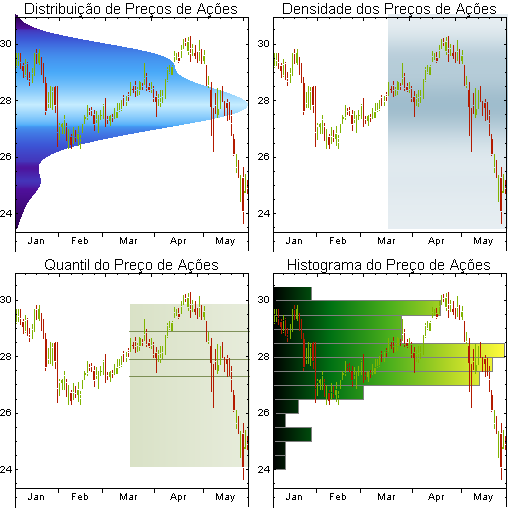
Combine gráficos candelabro com visualizações estatísticas mostrando a distribuição de preços de fechamento.
In[1]:=
X
data = FinancialData["MSFT", "OHLC", {{2010, 1}, {2010, 5, 31}}];
In[2]:=
X
close = data[[All, 2, 4]];
In[3]:=
X
l = (#[[-1]] - #[[1]]) &[First[HistogramList[close, {0.5}]]];
In[4]:=
X
g = Histogram[close, {0.5}, BarOrigin -> Left, Axes -> False, AspectRatio -> Full, PlotRangePadding -> None, ChartBaseStyle -> EdgeForm[Gray], ChartElementFunction -> ChartElementDataFunction["GradientScaleRectangle", "ColorScheme" -> "AvocadoColors"]];
In[5]:=
X
g2 = Graphics[ ChartElementData["SmoothDensity", "Shape" -> "SingleSided", "ColorScheme" -> "DeepSeaColors"][{{0, 1}, {0, 1}}, close], AspectRatio -> Full, PlotRangePadding -> None];
In[6]:=
X
g3 = DistributionChart[close, ChartElementFunction -> "Density", BarSpacing -> 0, Frame -> False, PlotRangePadding -> None, ChartBaseStyle -> Directive[EdgeForm[], Opacity[0.7]], ChartStyle -> ColorData[1][9], AspectRatio -> Full];
In[7]:=
X
g4 = DistributionChart[close, ChartElementFunction -> "FadingQuantile", BarSpacing -> 0, Frame -> False, PlotRangePadding -> None, ChartBaseStyle -> Directive[EdgeForm[], Opacity[0.5]], ChartStyle -> ColorData[14][6], AspectRatio -> Full];
In[8]:=
X
Grid[{{Show[{Graphics[Inset[g2, {0.5, 24}, {0.5, 24}, Length[close]]], CandlestickChart[data]}, AspectRatio -> 1, ImageSize -> 250, PlotRange -> {{0.5, Length[close] + 0.5}, {Min[data[[All, 2, 3]]], Max[data[[All, 2, 2]]]} + {-0.15, 0.1} (Max[data[[All, 2, 2]]] - Min[data[[All, 2, 3]]])}, Axes -> False, PlotLabel -> Style["Distribuição de Preços de Ações", 15], Frame -> {Left, Top, Right}, BaseStyle -> {FontFamily -> "Helvetica"}], Show[{Graphics[Inset[g3, {0.5, 24}, {0, 24}, Length[close]]], CandlestickChart[data]}, AspectRatio -> 1, ImageSize -> 250, PlotRange -> {{0.5, Length[close] + 0.5}, {Min[data[[All, 2, 3]]], Max[data[[All, 2, 2]]]} + {-0.15, 0.1} (Max[data[[All, 2, 2]]] - Min[data[[All, 2, 3]]])}, Axes -> False, PlotLabel -> Style["Densidade dos Preços de Ações", 15], Frame -> {Left, Top, Right}, BaseStyle -> {FontFamily -> "Helvetica"}]}, {Show[{Graphics[ Inset[g4, {0.5, 24}, {0, 24}, {Length[close], l}]], CandlestickChart[data]}, AspectRatio -> 1, ImageSize -> 250, PlotRange -> {{0.5, Length[close] + 0.5}, {Min[data[[All, 2, 3]]], Max[data[[All, 2, 2]]]} + {-0.15, 0.1} (Max[data[[All, 2, 2]]] - Min[data[[All, 2, 3]]])}, Axes -> False, PlotLabel -> Style["Quantil do Preço de Ações", 15], Frame -> {Left, Top, Right}, BaseStyle -> {FontFamily -> "Helvetica"}], Show[{Graphics[Inset[g, {0.5, 24}, {0, 24}, {Length[close], l}]], CandlestickChart[data]}, AspectRatio -> 1, ImageSize -> 250, PlotRange -> {{0.5, Length[close] + 0.5}, {Min[data[[All, 2, 3]]], Max[data[[All, 2, 2]]]} + {-0.15, 0.1} (Max[data[[All, 2, 2]]] - Min[data[[All, 2, 3]]])}, Axes -> False, PlotLabel -> Style["Histograma do Preço de Ações", 15], Frame -> {Left, Top, Right}, BaseStyle -> {FontFamily -> "Helvetica"}]}}]
Out[8]=