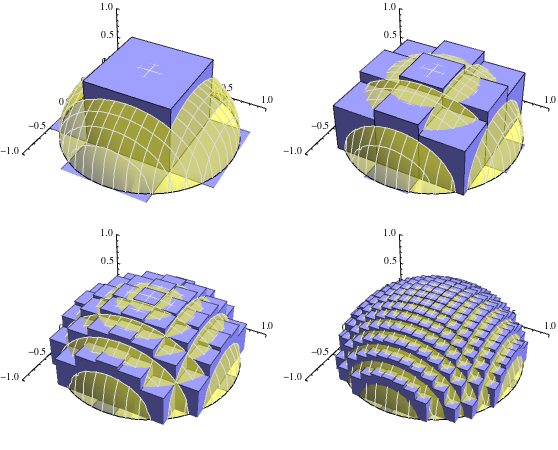
New in Wolfram
Mathematica
8: Capacidad de visualización de información nueva y mejorada
◄
previous
|
next
►
Gráficos y visualización
Visualice sumas de Riemann 3D
Muestra aproximaciones de sumas de Riemann al volumen bajo una superficie.
In[1]:=
X
plot = Plot3D[Sqrt[1 - x^2 - y^2], {x, -1, 1}, {y, -1, 1}, PlotStyle -> Directive[Opacity[0.5], Yellow], MeshStyle -> LightGray];
In[2]:=
X
Grid[Partition[ Table[Show[plot, DiscretePlot3D[Sqrt[1 - x^2 - y^2], {x, -1, 1, d}, {y, -1, 1, d}, ExtentSize -> Full, FillingStyle -> Opacity[1], PlotStyle -> Lighter[Blue]], Lighting -> "Neutral", ImageSize -> 275, Boxed -> False, PlotRangePadding -> 0, AxesEdge -> {{1, -1}, {-1, -1}, {-1, 1}}], {d, {1, 1/2, 1/4, 1/8}}], 2]]
Out[2]=