Gráficos & Visualização
Visualize somas de Riemann 3D
Mostre aproximações de somas de Riemann para o volume sob uma superfície.
| In[1]:= | 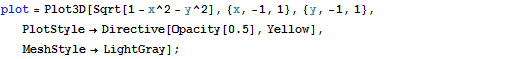 X |
| In[2]:= | 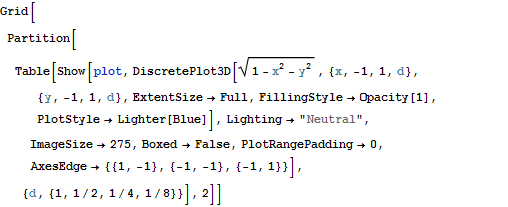 X |
| Out[2]= | 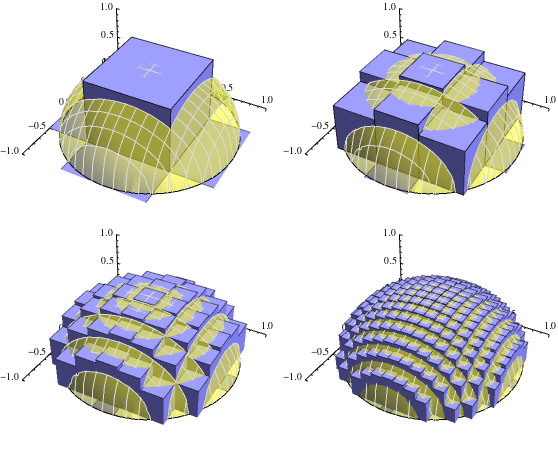 |
| Novos Recursos do Mathematica 8: Visualização Científica e de Informação Novas e Melhoradas | ◄ anterior | próximo ► |
| In[1]:= | X |
| In[2]:= | X |
| Out[2]= | |