핵심 알고리즘
풍력 터빈의 에너지 생산 분석
WeibullDistribution을 이용하여 풍속을 모델링하고 GE 1.5MW 풍력 터빈으로 측정된 효율 곡선을 사용하여 1 년간 예상 에너지 생산 가치를 구합니다.
| In[1]:= | 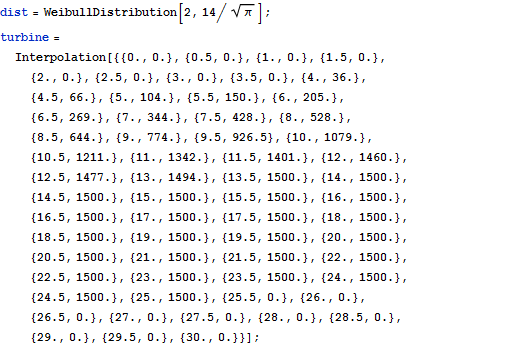 X |
| In[2]:= | 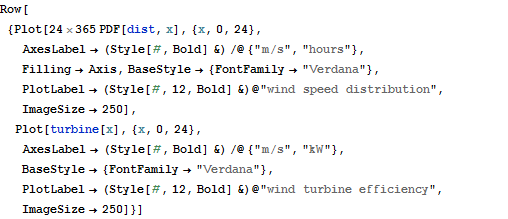 X |
| Out[2]= | 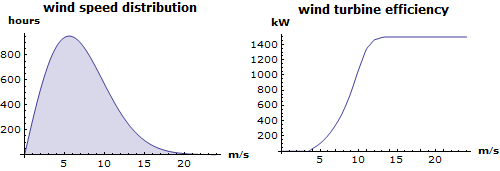 |
| In[3]:= | X |
| Out[3]= |
| Wolfram Mathematica 8의 신기능: 매개 변수 확률 분포 | ◄ 이전 | 다음 ► |
| In[1]:= | X |
| In[2]:= | X |
| Out[2]= | |
| In[3]:= | X |
| Out[3]= |