Gráficos y visualización
Histograma con escala logarítmica
La distribución de grado de vértice para PriceGraphDistribution es de cola pesada. Usar escalas logarítmicas para los ejes hace que el histograma sea más fácil de leer.
| In[1]:= | X |
| In[2]:= | X |
| In[3]:= | 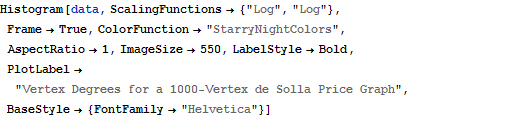 X |
| Out[3]= | 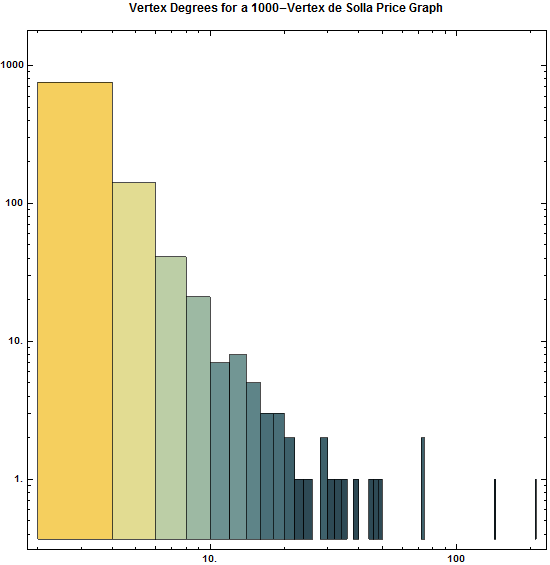 |