Gráficos y visualización
Especifique tamaños de intervalos para histogramas
Diagrame histogramas usando una especificación de binning, un ancho específico, o un número total deseado de compartimientos.
| In[1]:= |  X |
| Out[1]= | 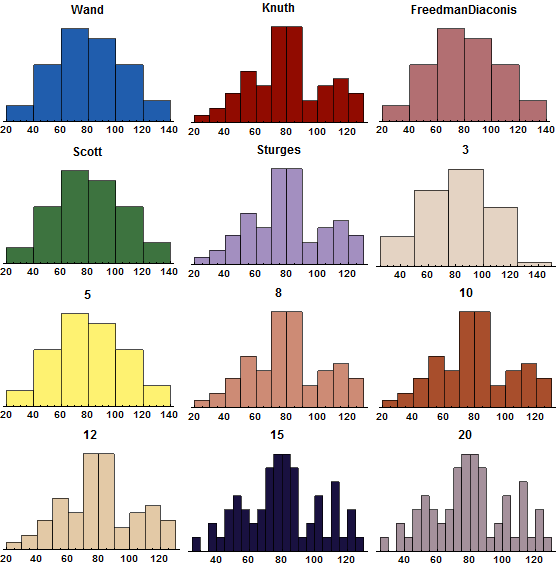 |
| New in Wolfram Mathematica 8: Visualización estadística | ◄ previous | next ► |
| In[1]:= | X |
| Out[1]= | |