New in Wolfram Mathematica 7: New Categories of Special Functions  previous | next 
Plot the Multiple Gamma Function BarnesG
Visualize the BarnesG function over the complex plane.
In[1]:=

Click for copyable input
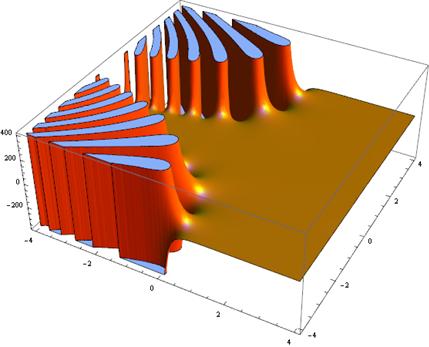
Plot3D[Re[BarnesG[x + I y]], {x, -4, 4}, {y, -4, 4}, Mesh -> None, 

 PlotStyle -> Directive[Orange, Specularity[White, 30]], 

 PlotPoints -> 35]
Out[1]=