Gráficos y visualización
Gráfico de punto y figura
Use un gráfico de punto y figura para comprimir tendencias en una columna única.
| In[1]:= | X |
| In[2]:= |  X |
| Out[2]= | 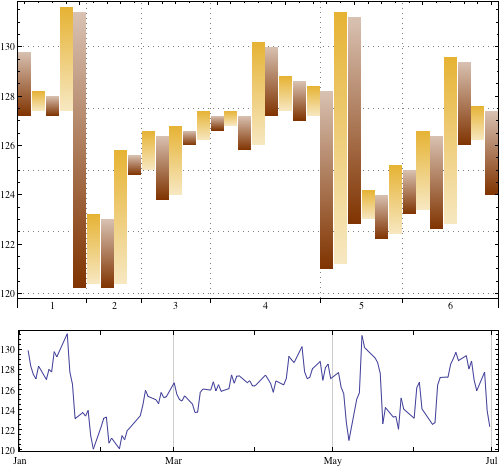 |
| New in Wolfram Mathematica 8: Visualización financiera | ◄ previous | next ► |
| In[1]:= | X |
| In[2]:= | X |
| Out[2]= | |