Wolfram
Mathematica
8의 신기능: 금융 시각화
◄
이전
|
다음
►
그래픽 및 시각화
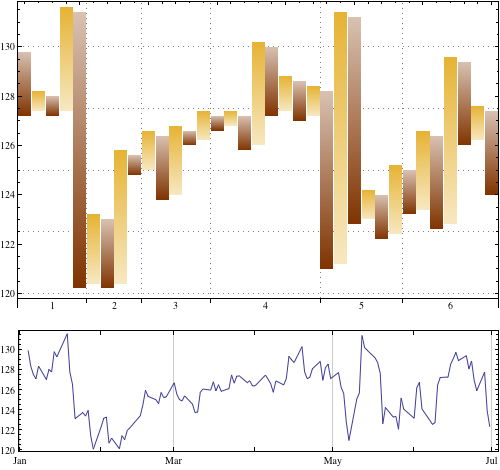
P&F(Point Figure)도표
P&F (point-and-figure) 도표를 사용하여 추세를 단일행에 압축하여 보여 줍니다.
In[1]:=
X
data = FinancialData["IBM", {{2010, 1, 1}, {2010, 6, 30}}];
In[2]:=
X
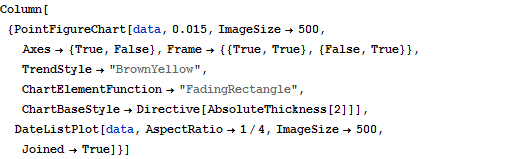
Column[{PointFigureChart[data, 0.015, ImageSize -> 500, Axes -> {True, False}, Frame -> {{True, True}, {False, True}}, TrendStyle -> "BrownYellow", ChartElementFunction -> "FadingRectangle", ChartBaseStyle -> Directive[AbsoluteThickness[2]]], DateListPlot[data, AspectRatio -> 1/4, ImageSize -> 500, Joined -> True]}]
Out[2]=