Datenverarbeitung
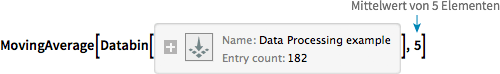
Glätten Sie Daten durch den gleitenden Mittelwert:
| In[1]:= |
| Out[1]= |
|
| In[2]:= |

| Out[2]= |
|
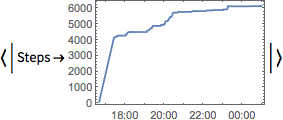
Akkumulieren Sie Werte, um Partialsummen zu ermitteln:
| In[1]:= |

| Out[1]= |

|
| In[2]:= |
| Out[2]= |
|
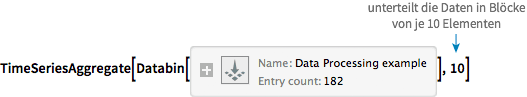
Ermitteln Sie die Durchschnitte für Werteblöcke:
| In[1]:= |
| Out[1]= |
|
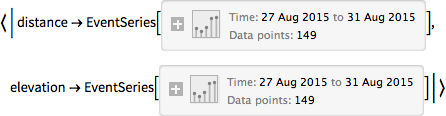
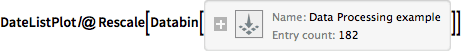
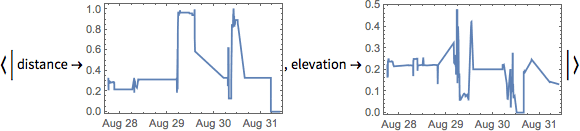
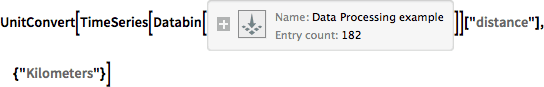
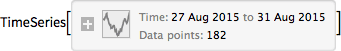
Skalieren Sie alle Werte in allen Zeitreihen neu:
| In[1]:= |
| Out[1]= |
|
Rescale Normalize Standardize Threshold Clip
Wenden Sie eine Funktion auf Werte einer bestimmten Zeitreihe an:
| In[2]:= |
| Out[2]= |
|
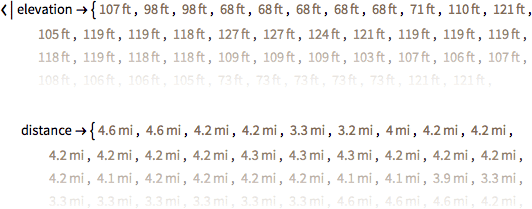
Erhalten Sie reine Wertelisten ohne Zeitstempel:
| In[1]:= |
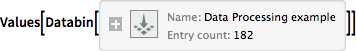
| Out[1]= |
|
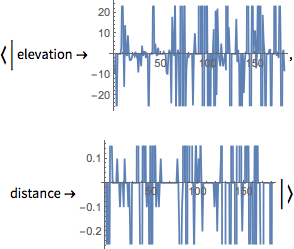
| In[2]:= |
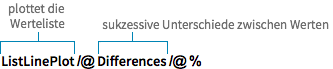
| Out[2]= |
|
Differences LowpassFilter MaxFilter Fourier PowerSpectralDensity
ZUM NACHSCHLAGEN: Lineare und nichtlineare Filter »


