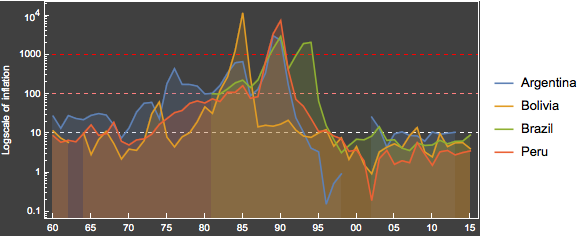
Analysez les taux d'hyperinflation des pays d'Amérique du Sud
Connectez-vous à l'API du Federal Reserve Economic Data.
In[1]:=
fred = ServiceConnect["FederalReserveEconomicData"]Out[1]=
Obtenez une liste des pays d'Amérique du Sud.
In[2]:=
countries = CountryData["SouthAmerica"];Récupérez l'inflation des séries temporelles des pays choisis.
In[3]:=
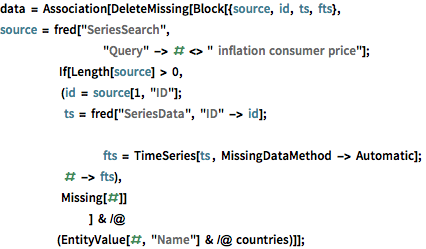
data = Association[DeleteMissing[Block[{source, id, ts, fts},
       source =
        fred["SeriesSearch",
         "Query" -> # <> "  inflation consumer price"];
              	If[Length[source] > 0,
                	(id = source[1, "ID"];
                  	ts = fred["SeriesData", "ID" -> id];

         fts = TimeSeries[ts , MissingDataMethod -> Automatic];
                  	# -> fts),
                	Missing[#]]
       		] & /@ (EntityValue[#, "Name"] & /@ countries)]];
Créez le tracé des pays ayant connu une hyperinflation au cours de la période 1960-2015.
Afficher l'entrée complète de Wolfram Language
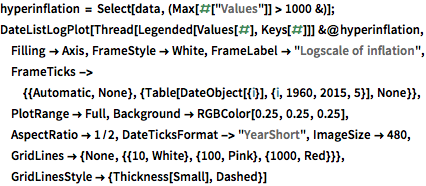
Out[4]=