‹›Visualisierung: Beschriftungen, Maßstäbe, DefinitionslückenAchsenskalierung
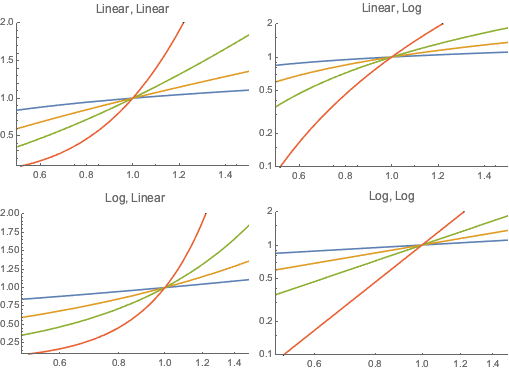
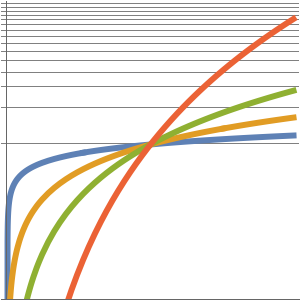
Wenden Sie Skalierungsfunktionen auf jede beliebige Achse an.
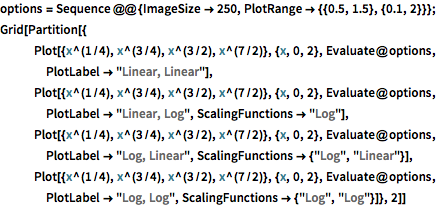
Den kompletten Wolfram Language-Input zeigen
options =
  Sequence @@ {ImageSize -> 250,
    PlotRange -> {{0.5, 1.5}, {0.1, 2}}};
Grid[Partition[{
   Plot[{x^(1/4), x^(3/4), x^(3/2), x^(7/2)}, {x, 0, 2},
    Evaluate@options, PlotLabel -> "Linear, Linear"],
   Plot[{x^(1/4), x^(3/4), x^(3/2), x^(7/2)}, {x, 0, 2},
    Evaluate@options, PlotLabel -> "Linear, Log",
    ScalingFunctions -> "Log"],
   Plot[{x^(1/4), x^(3/4), x^(3/2), x^(7/2)}, {x, 0, 2},
    Evaluate@options, PlotLabel -> "Log, Linear",
    ScalingFunctions -> {"Log", "Linear"}],
   Plot[{x^(1/4), x^(3/4), x^(3/2), x^(7/2)}, {x, 0, 2},
    Evaluate@options, PlotLabel -> "Log, Log",
    ScalingFunctions -> {"Log", "Log"}]}, 2]]